Understanding the Apex Indicator in Bank Nifty Trading
The Apex Indicator is a strength indicator that helps traders analyze the underlying trend of Bank Nifty. It provides insights into whether the market is showing strength or weakness. This indicator is plotted on a graph alongside Bank Nifty to compare their relative movements.
Structure of the Apex Indicator
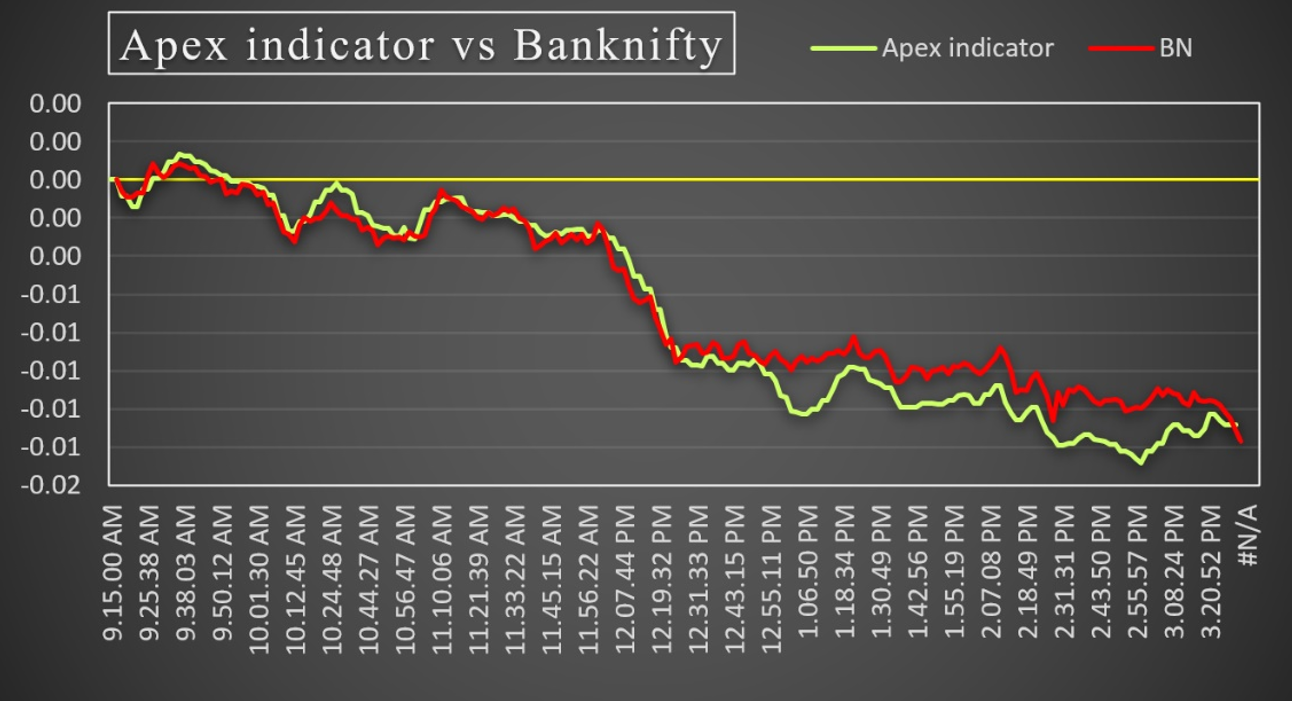
Zero Line (O-Level):
- The Apex Indicator has a zero line, which acts as a reference point.
- If the Apex Indicator stays above the zero line, it suggests that Bank Nifty is in a strong phase.
- If the Apex Indicator moves below the zero line, it indicates weakness in Bank Nifty.
- Additionally, traders need to observe whether the Apex Indicator is increasing or decreasing, as this can signal future price action.
Interpreting the Apex Indicator with Bank Nifty
There are situations where the movements of the Apex Indicator and Bank Nifty diverge. These instances provide crucial trading signals:
1. Apex Indicator Decreasing, but Bank Nifty Holding Steady:
This suggests that Bank Nifty might decline in the near future.
2. Apex Indicator Increasing, but Bank Nifty Not Rising Yet:
This indicates that Bank Nifty might soon experience an upward movement.
Understanding Gaps Between Apex Indicator and Bank Nifty
When a gap forms between the Apex Indicator and Bank Nifty, it often signals a potential reversal.
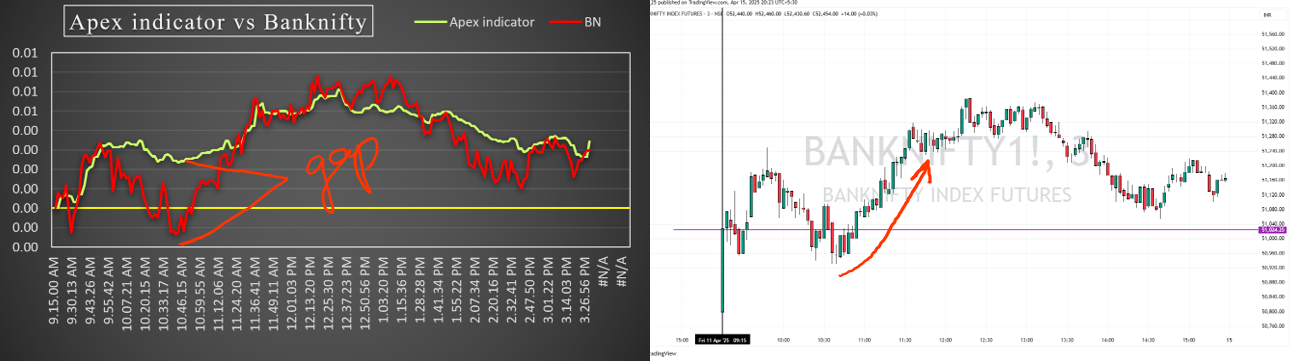
1. Bullish Gap Formation
- Bank Nifty is continuously decreasing, but the Apex Indicator is not decreasing significantly, creating a gap.
- This suggests that Bank Nifty may soon reverse and move upward.
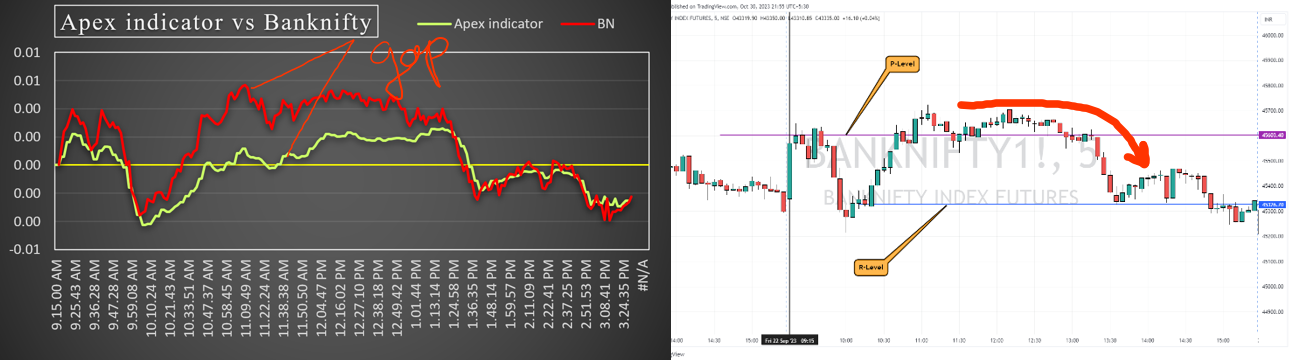
2. Bearish Gap Formation
- Bank Nifty is rising, but the Apex Indicator is not increasing much, forming a gap.
- This signals a potential downtrend or reversal in Bank Nifty.
Trading Strategies Using the Apex Indicator
Since the Apex Indicator is a data-driven tool, it should not be used in isolation. Instead, traders should combine it with the Equity Matrix to confirm trends.
Scenario 1: Long Trade Setup (Bullish Gap Formation)
- A bullish gap forms between the Apex Indicator and Bank Nifty.
- Traders should wait for confirmation from the Equity Matrix trend.
- If the Equity Matrix starts increasing and Bank Nifty is trading near a support level, it is a good time to initiate a long trade.
Scenario 2: Short Trade Setup (Bearish Gap Formation)
- A bearish gap forms between the Apex Indicator and Bank Nifty.
- Traders should look for confirmation by checking the Equity Matrix trend.
- If the Equity Matrix starts decreasing, and Bank Nifty is near a resistance level or breaking a trendline, a short trade can be initiated.
Conclusion
The Apex Indicator plays a significant role in analyzing Bank Nifty's strength and potential reversals. When used correctly—especially in combination with the Equity Matrix—it can help traders make data-driven trading decisions. Understanding gaps and divergence between the Apex Indicator and Bank Nifty can give traders an edge in predicting future price movements and executing successful trades.