Understanding the Equity Matrix
The Equity Matrix is a tool used to understand the overall movement of the banking sector, particularly focusing on the actions of big players (institutional investors) in the market. It helps traders and investors gauge the strength of the market and provides trend confirmation.
Key Features of the Equity Matrix:
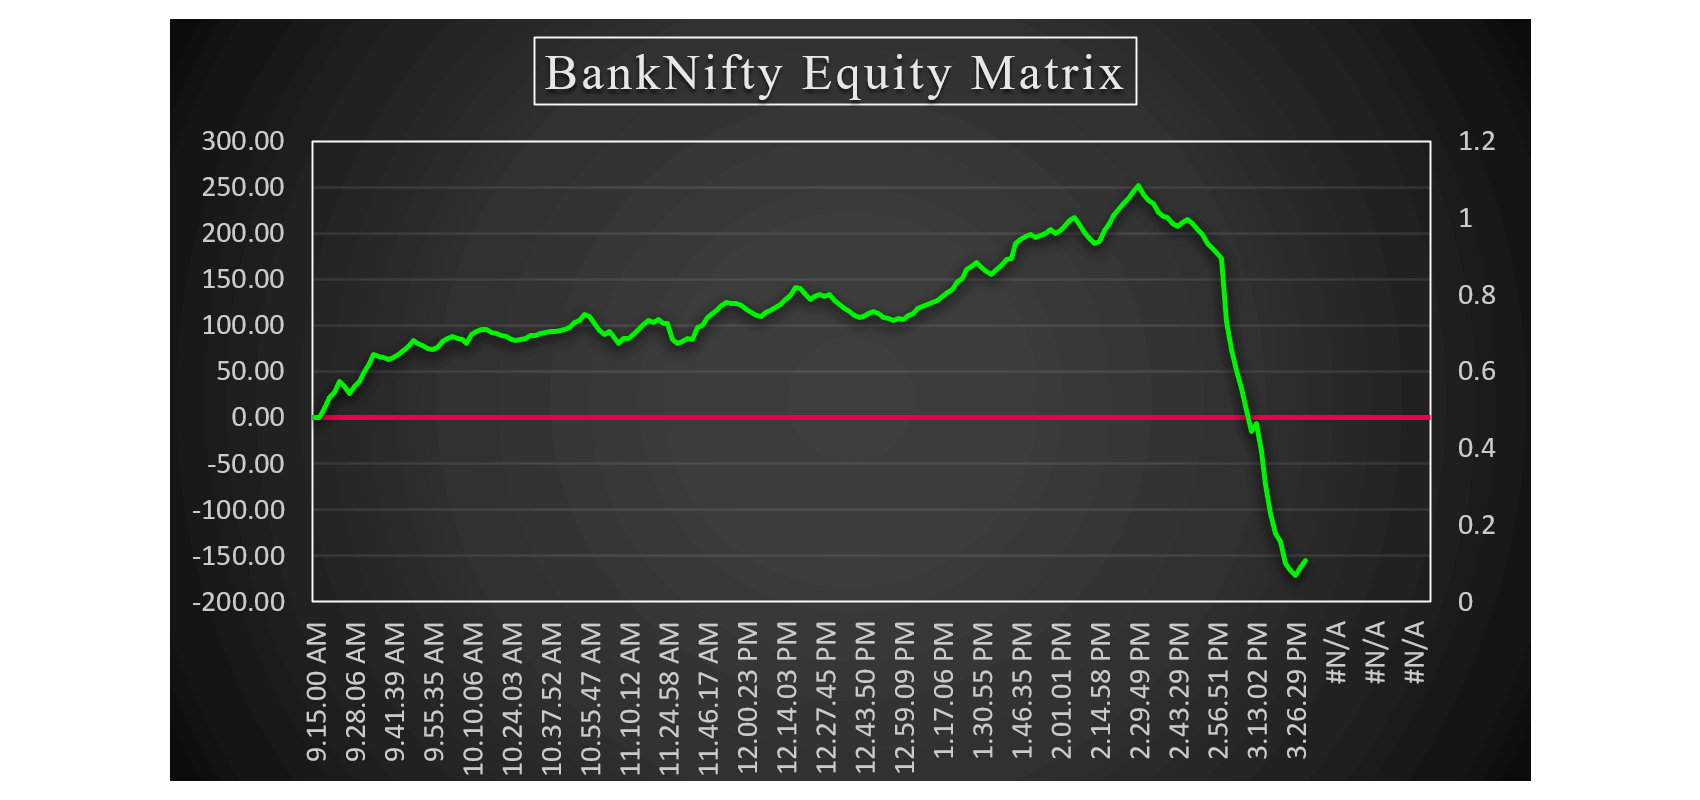
- Green Line Representation:
The Equity Matrix is represented by the green line on the chart. - Zero Line Reference:
The Equity Matrix starts from the zero level, and the line's position relative to zero gives insight into the market sentiment.
How to Interpret the Equity Matrix:
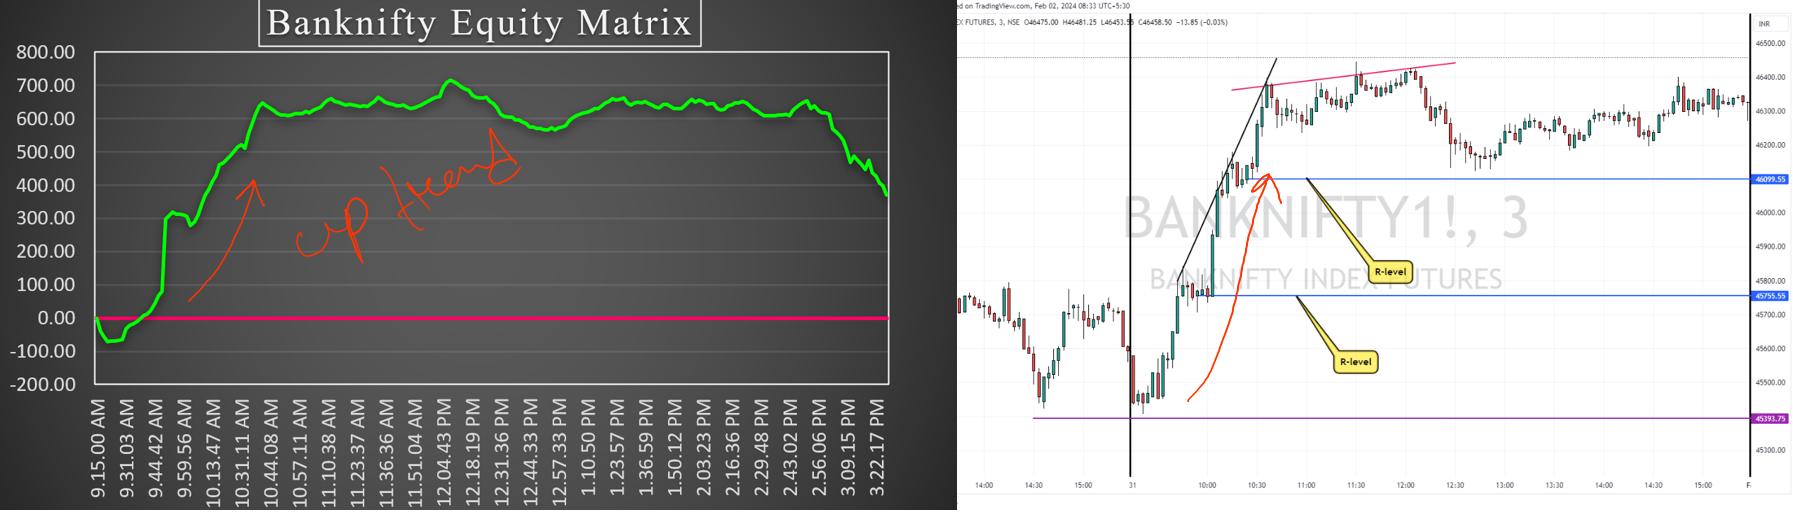
1. When the Equity Matrix is Above the Zero Line (Bullish Signal):
Institutional Buying Activity:
If the green line is above the zero level, it indicates that big institutions are taking bullish positions in the banking sector.
This suggests that large investors are confident in the market and expect positive movement. Therefore, it's a sign of potential buying opportunities.
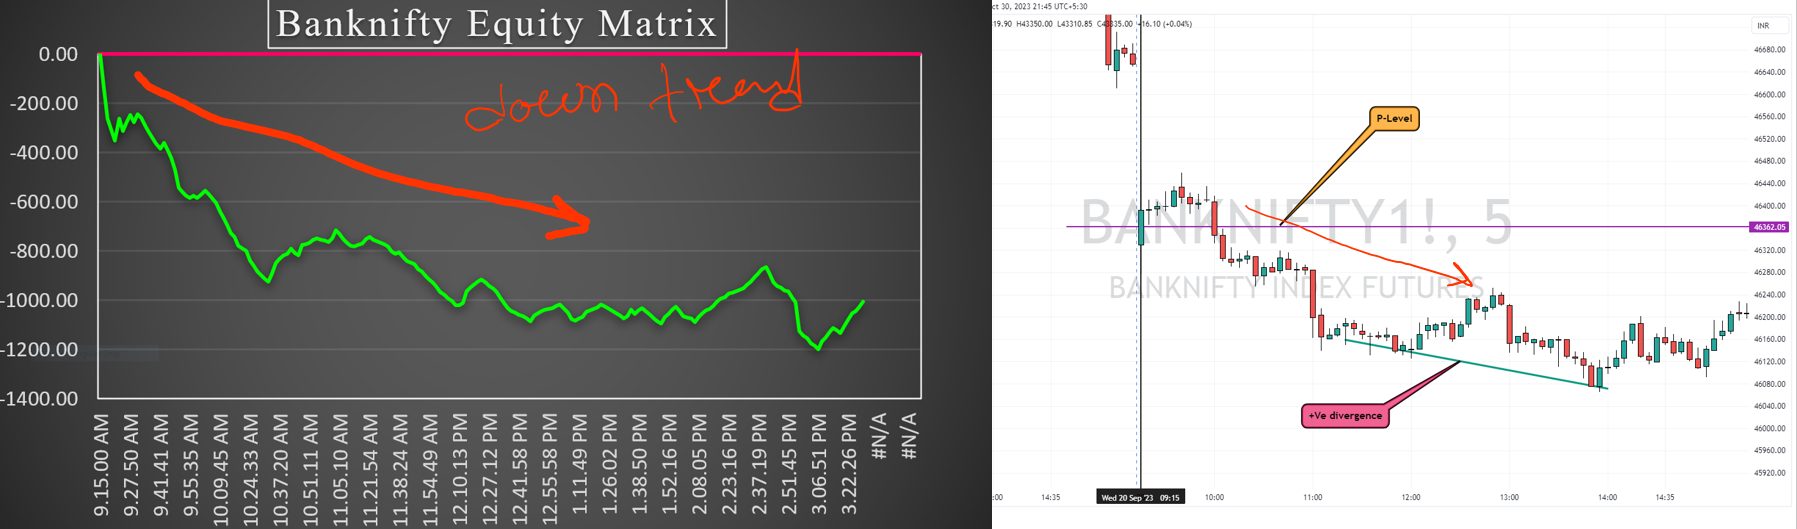
2. When the Equity Matrix is Below the Zero Line (Bearish Signal):
Institutional Selling or Position Closing:
If the green line is below the zero level, it suggests that big institutions are either closing their positions or becoming bearish.
This means large players may be withdrawing from the banking sector or positioning themselves for a potential downturn.
It's a sign of weakness in the market, and traders should consider caution or look for short trade opportunities.
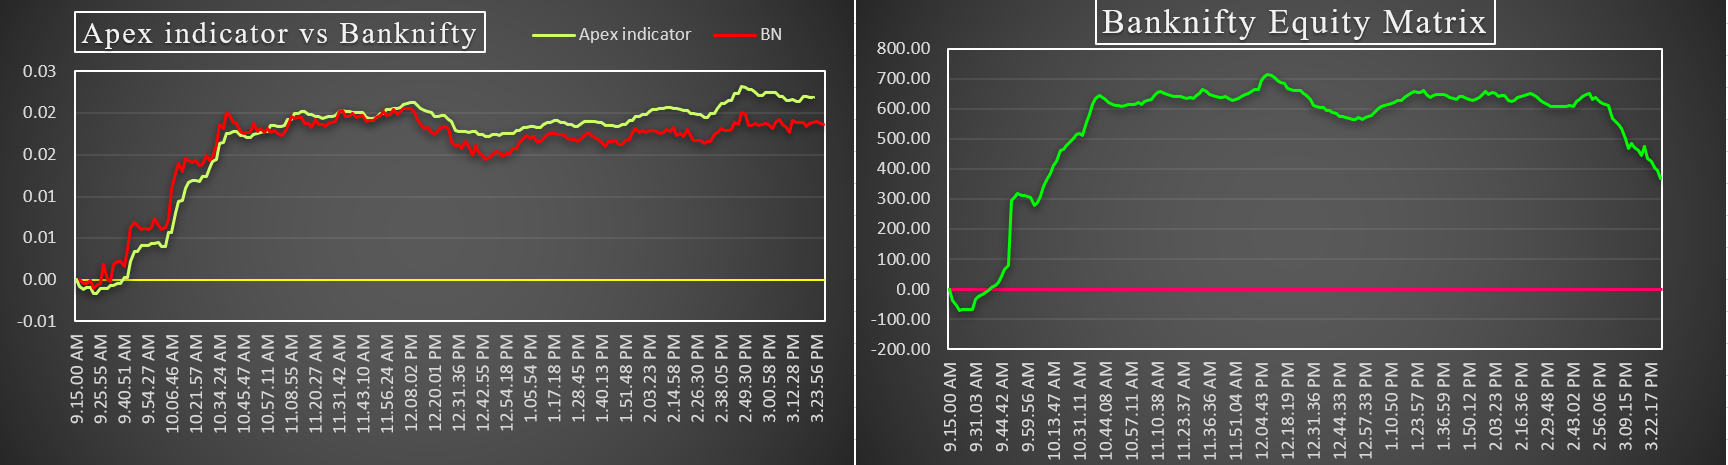
Using the Equity Matrix for Trend Confirmation:
- The Equity Matrix can be used as a trend confirmation tool to validate the direction indicated by other indicators (like the Apex Indicator).
- For example, if the Apex Indicator suggests strength but the Equity Matrix is below the zero line, it would indicate a contradiction or potential weakness.
- Conversely, if both the Apex Indicator and Equity Matrix are aligned (both showing strength above the zero line), it provides strong confirmation for a bullish trend in the banking sector.
Conclusion:
- Above Zero: The Equity Matrix above the zero line indicates that big players are bullish on the banking sector, and it's a signal to potentially enter long trades.
- Below Zero: The Equity Matrix below the zero line signals that big players are turning bearish or closing their positions, which could suggest selling opportunities or a short trade setup.
The Equity Matrix, when combined with other indicators like the Apex Indicator, can give a clearer view of the overall market sentiment, helping traders make more informed decisions.