Understanding the Nano Indicator
The Nano Indicator is a trend-following indicator specifically designed for intraday trading, particularly in Bank Nifty. It helps traders identify the prevailing trend and can also be used as a trailing stop-loss tool to manage risk effectively.
Key Features of the Nano Indicator:
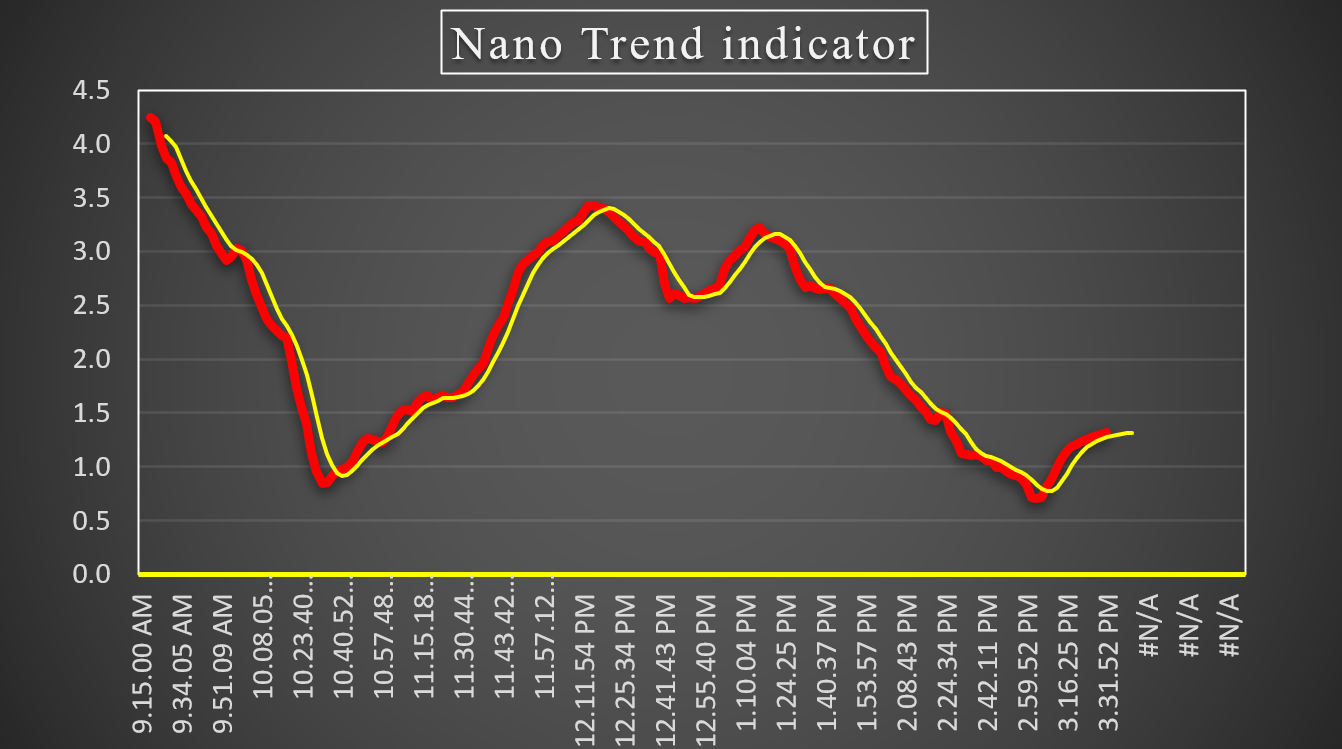
- Two Lines Representation:
- Yellow Line: Represents the Average of the Nano Indicator (Trend Smoother).
- Red Line: Represents the Nano Indicator (Actual Trend).
- Trend Identification:
- If the Yellow Line is below the Red Line → Trend is Positive (Bullish).
- If the Yellow Line is above the Red Line → Trend is Negative (Bearish).
- Filters Market Noise:
- The Nano Indicator reduces small market fluctuations and only shows clear trends, making it useful for trend-following traders.
How to Use the Nano Indicator for Intraday Trading?
For a Buy (Long Trade) Setup:
- The Red Line crosses above the Yellow Line, confirming a bullish trend.
- This indicates that Bank Nifty is gaining strength, and traders can enter a long position.
- The indicator can also be used for trailing stop-loss.
For a Sell (Short Trade) Setup:
- The Red Line crosses below the Yellow Line, confirming a bearish trend.
- This suggests Bank Nifty is losing strength, and traders can enter a short position.
- Traders can trail their stop-loss by using the red line as a reference.
Nano Indicator Patterns and Their Meaning:
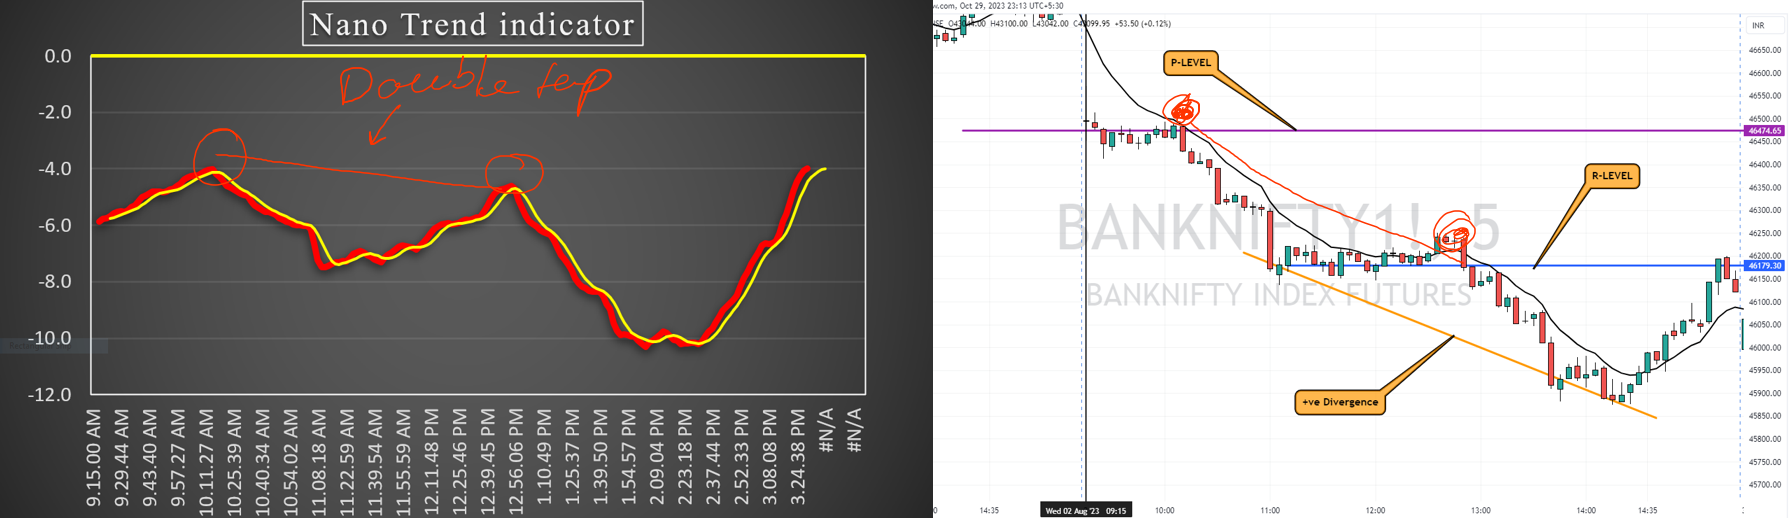
1. Bearish Pattern — Double Top Formation:
- If the Nano Indicator forms a Double Top pattern, it is a bearish signal.
- This suggests weakness in Bank Nifty, and traders should prepare for a potential downtrend or short-selling opportunity.
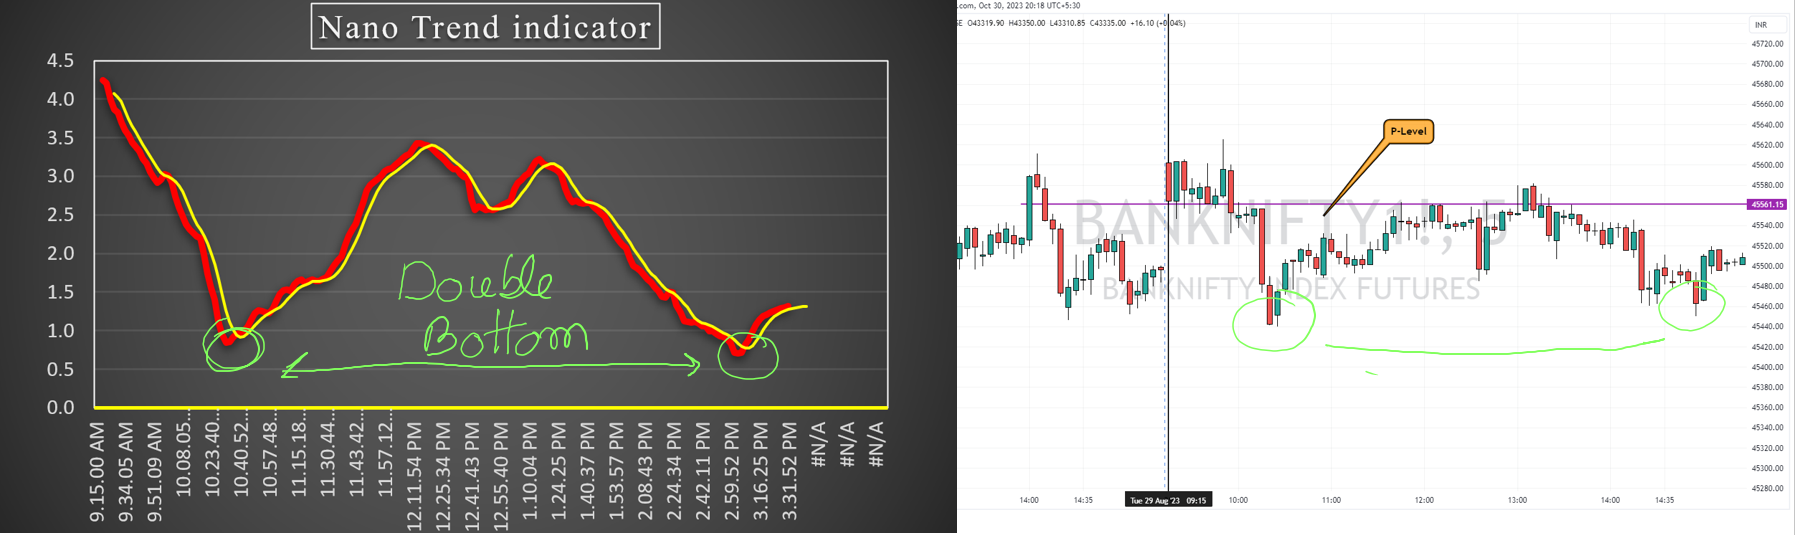
2. Bullish Pattern — Double Bottom Formation:
- If the Nano Indicator forms a Double Bottom pattern, it is a bullish signal.
- This suggests that Bank Nifty might reverse to an uptrend, providing an opportunity for buy trades.
Conclusion:
- The Nano Indicator is a powerful tool for intraday traders as it helps in identifying clear trends while filtering out market noise.
- It can be used for trend confirmation, trailing stop-loss, and identifying reversal patterns (Double Top for Bearish & Double Bottom for Bullish).
- When combined with other indicators like the Apex Indicator or Equity Matrix, it can provide high-probability trade setups in Bank Nifty.