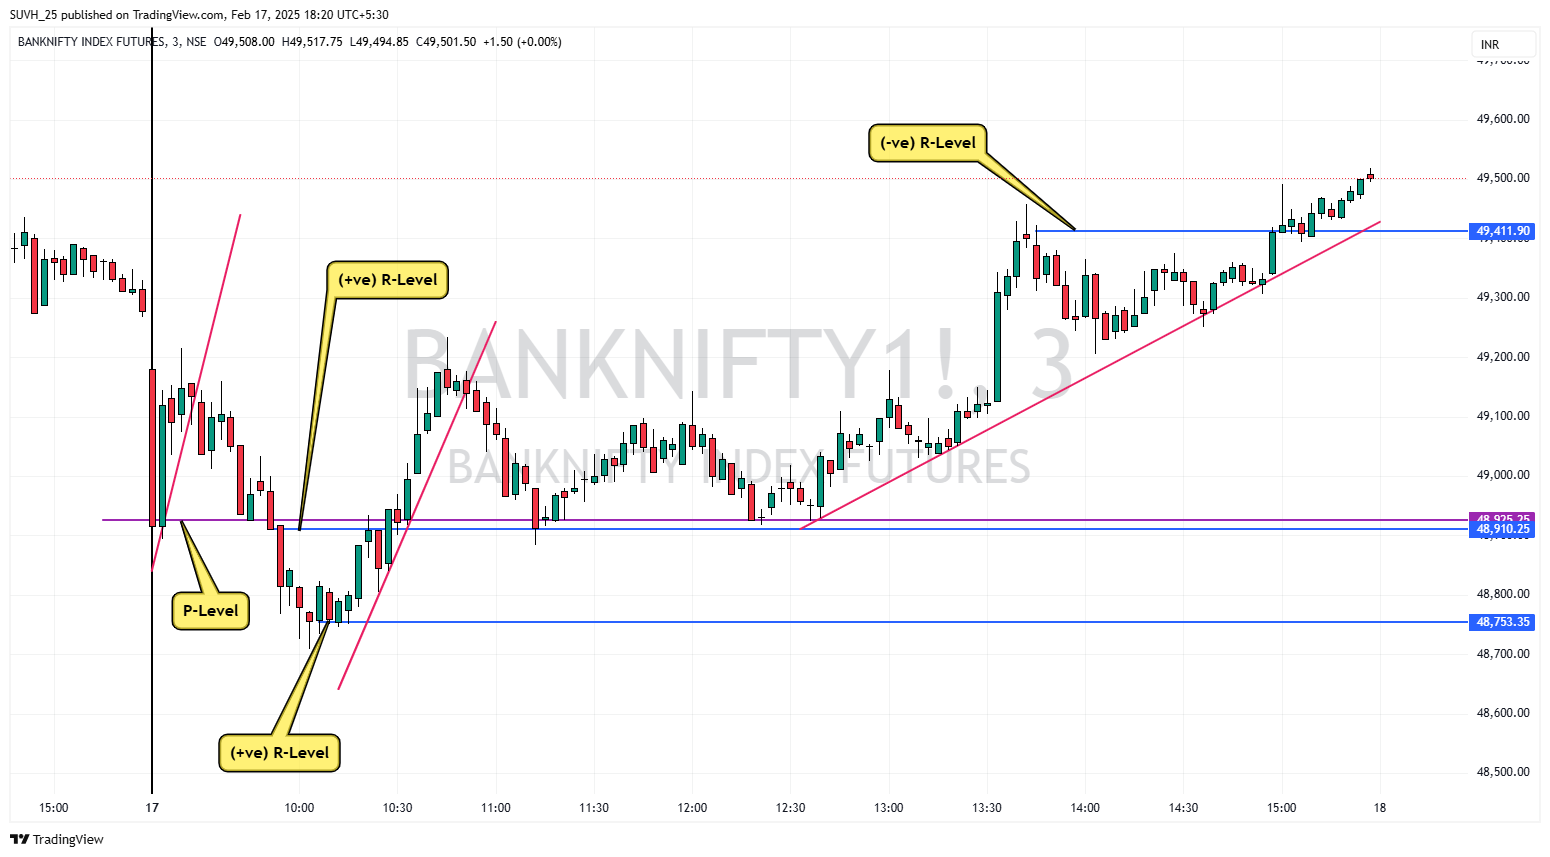
Understanding the Pressure Level (P-Level) BN Data Driven Trading Setup
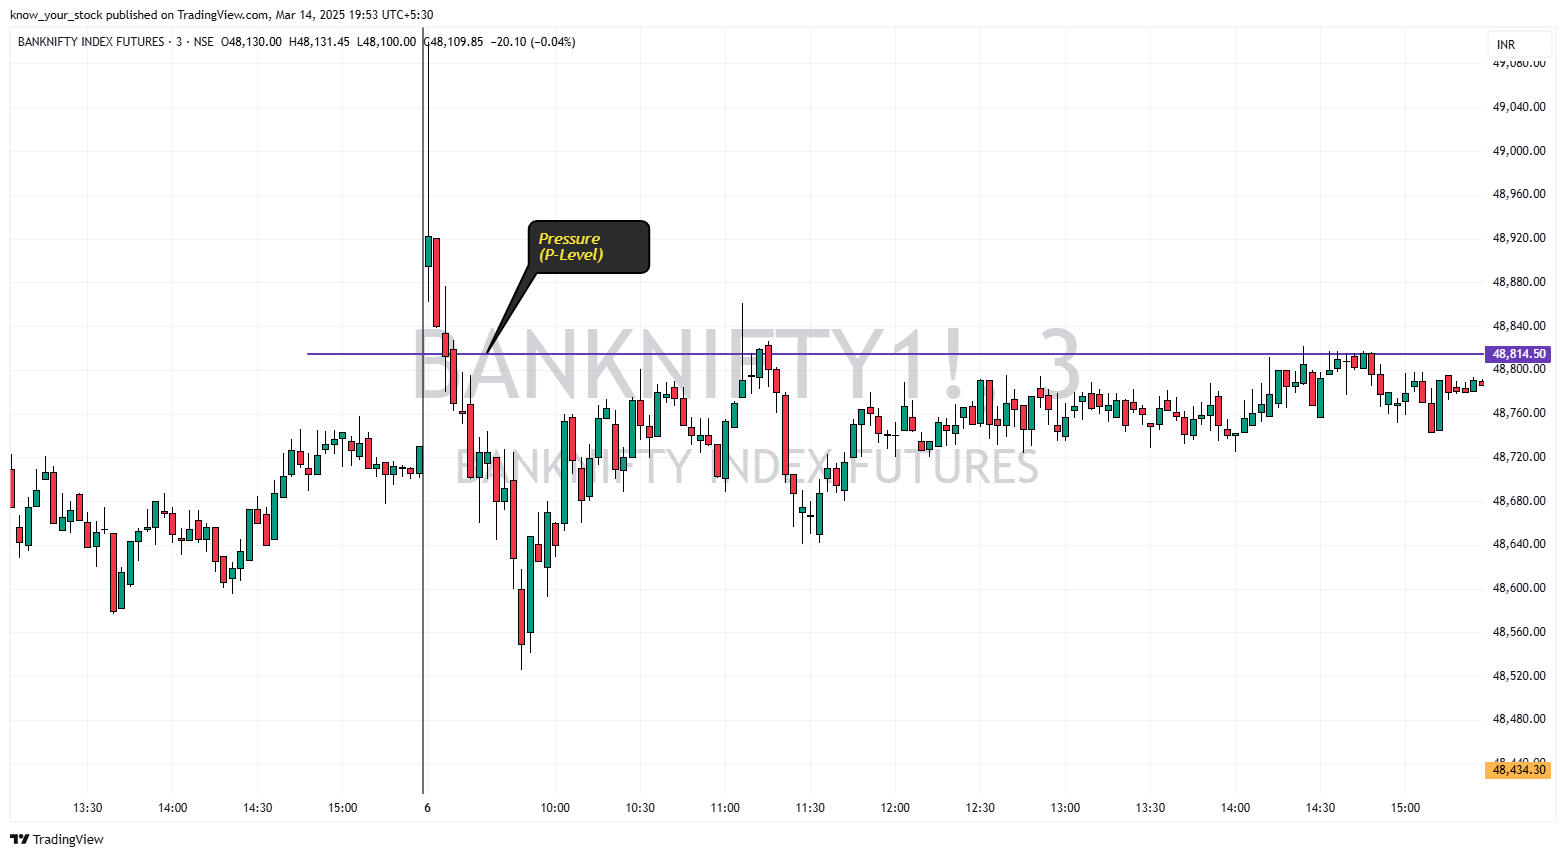
The Pressure Level (P-Level) is a crucial concept in trading, especially for strategies that rely on market strength and weakness. It acts as a key reference point for determining whether the market is bullish or bearish, helping traders make informed entry and exit decisions.
- Below P-Level: Indicates market weakness, suggesting a bearish trend.
- Above P-Level: Indicates market strength, suggesting a bullish trend.
How to Draw P-Level in a Bank Nifty Price Chart using Data-Driven Setup
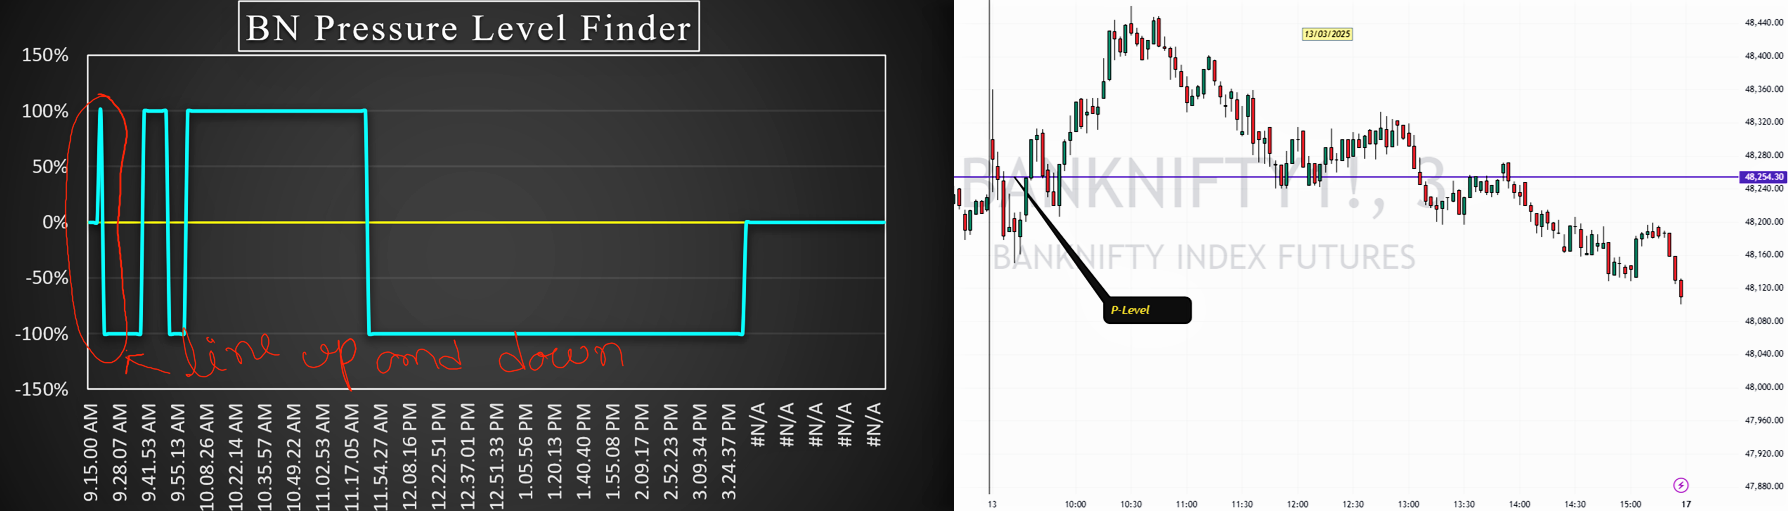
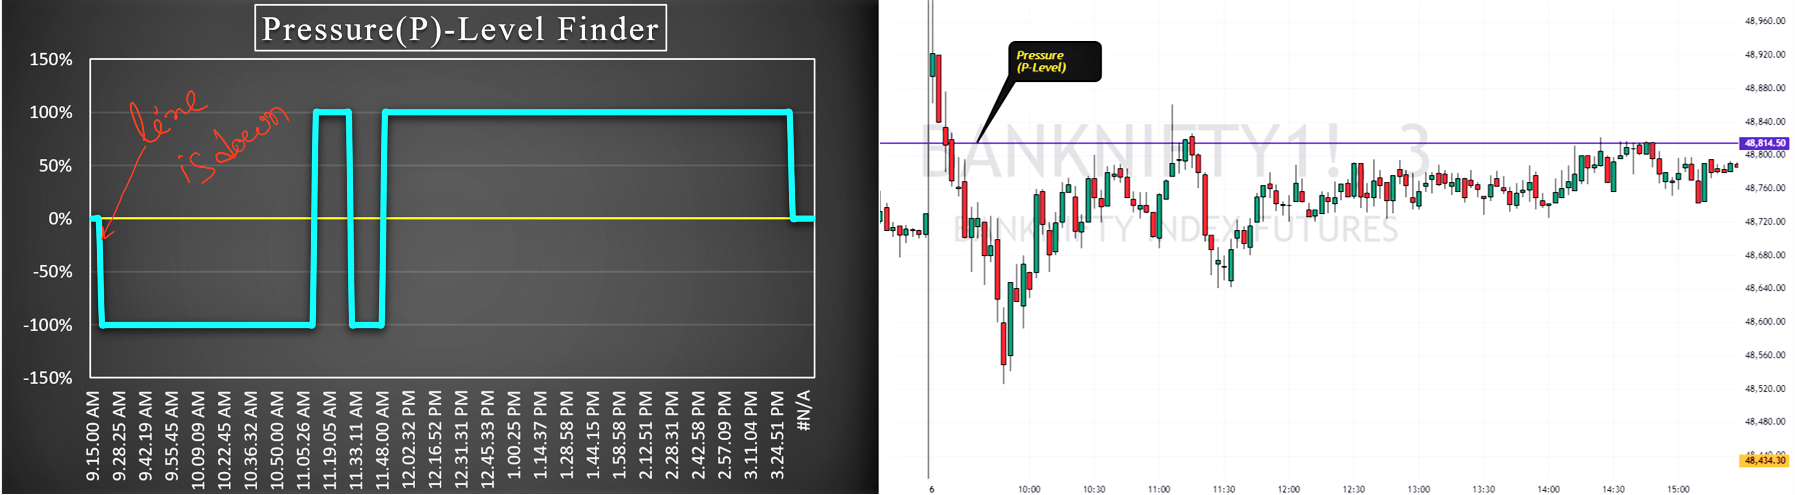
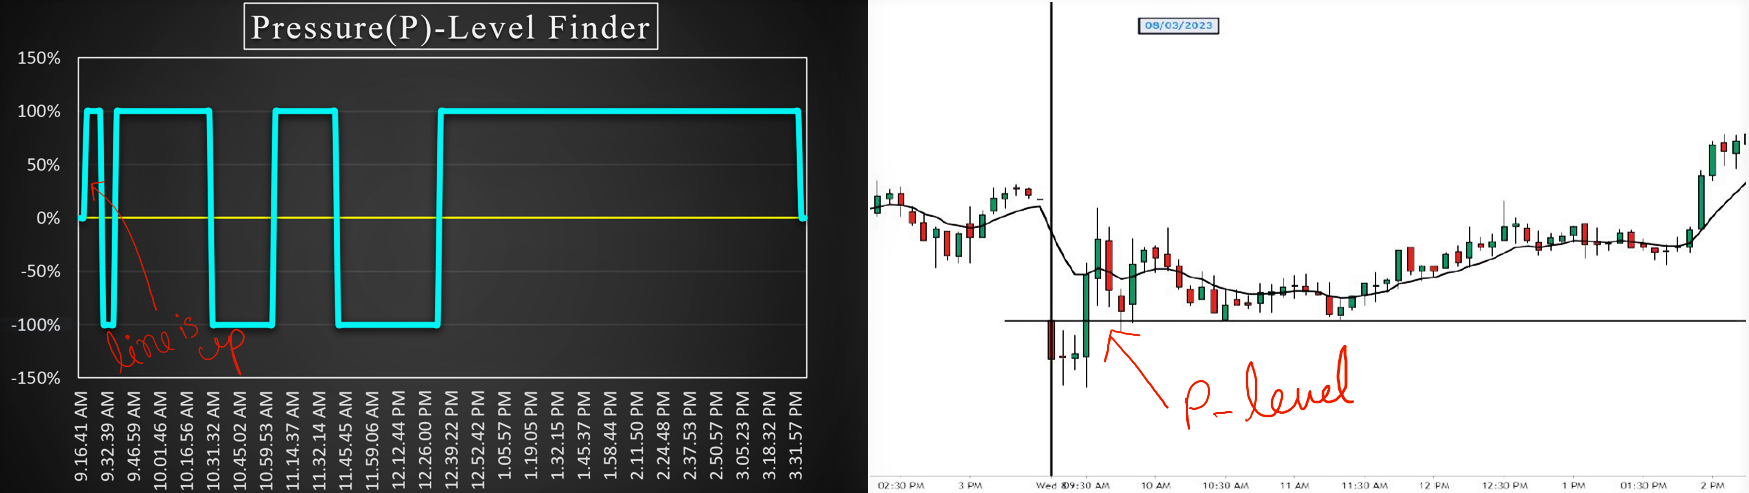
After observing the Bank Nifty current expiry future price chart and P-Level Finder graph at BN data-driven setup, you can establish the P-Level. It should be drawn only once in the morning, after the market opens, typically after completing 2 or 3 consecutive 3-minute candles.
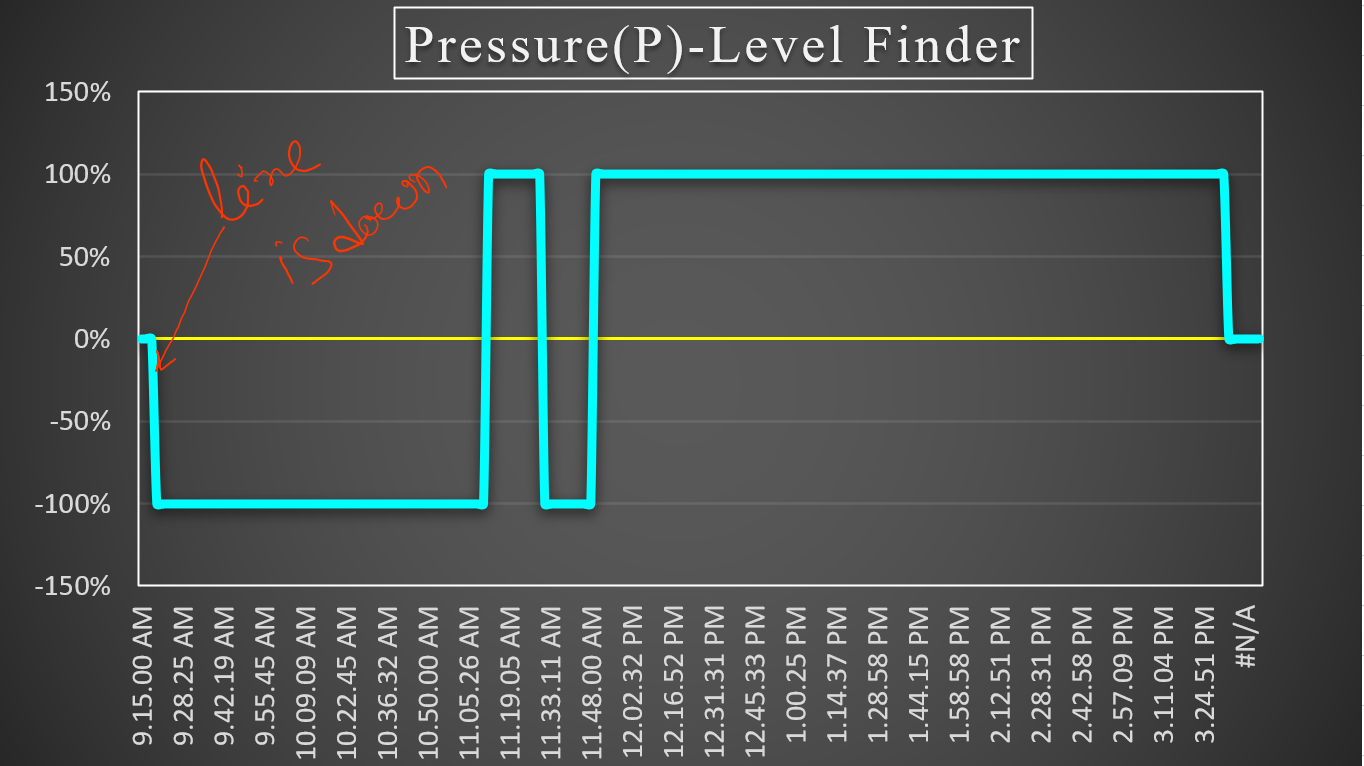
Steps to Draw P-Level
-
If the P-Level Finder's Line is Showing Upside:
Draw a P-level line at the higher side of the 3-minute candle, after completing two or three consecutive 3-minute candles.
-
If the P-Level Finder's Line is Showing Downside:
Draw a P-level line at the lower side of the 3-minute candle, after completing two or three consecutive 3-minute candles.
- If Big Players have created a strong bullish position at the opening, then the price must break the upper P-Level.
- If the price fails to break the upper P-Level, it indicates that the bullish position is not strong.
- If Big Players have created a strong bearish position at the opening, then the price must break the lower P-Level.
- If the price fails to break the lower P-Level, it means the bearish position is not strong.
Special Scenario: When the P-Level Finder Line Moves Up and Then Instantly Comes Down OR Down and Then Instantly Up
In this case, we draw the P-Level at the middle range of the three consecutive 3-minute candles.
- Practice is required to draw the P-Level correctly, as there can be many variations in the setup.
- We do not consider gap-ups and gap-downs when drawing the P-Level.
How to Trade Using the Pressure Level
Scenario 1: Short Trade Setup (Bearish Bias)
-
Identify the Pressure Level
- Observe Bank Nifty or any index for the first few minutes after the market opens.
- Use a P-Level Finder to determine and mark the pressure level on the chart.
-
Confirm Weakness Using Other Indicators
- Check indicators like Pulse, Apex, and Equity Matrix for bearish signals.
- If these indicators confirm weakness, it strengthens the short trade setup.
-
Validate Price Action
- Ensure the price is trading below the Pressure Level to confirm bearish bias.
-
Entry Strategy
- Use a 3-minute time frame for trade confirmation.
- Apply 10 EMA (Exponential Moving Average) as an additional entry filter.
- If the price retraces near the 10 EMA, it may offer a better entry point.
- For more precision, a 1-minute time frame with 10 EMA can also be used.
-
Stop-Loss Placement
- Place the stop-loss above the Pressure Level to manage risk effectively.
Scenario 2: Long Trade Setup (Bullish Bias)
-
Identify the Pressure Level
- Observe Bank Nifty for the first 3-5 minutes after market open.
- Use a P-Level Finder to determine and mark the pressure level on the price chart.
-
Confirm Strength Using Other Indicators
- Look at Pulse, Apex, and Equity Matrix to identify bullish signals.
- If these indicators confirm strength, it validates the long trade setup.
-
Validate Price Action
- If the price is trading above the Pressure Level, it signals market strength.
-
Entry Strategy
- Use a 3-minute time frame for better trade confirmation.
- Apply 10 EMA as an additional entry filter.
- If the price retraces near the 10 EMA, it may offer an optimal entry point.
- For more precision, use a 1-minute time frame with the 10 EMA.
-
Stop-Loss Placement
- Place the stop-loss below the Pressure Level to manage risk effectively.
Final Thoughts
The Pressure Level (P-Level) is a powerful tool that helps traders navigate the Bank Nifty market with greater confidence. By understanding whether the price is trading above or below the P-Level, traders can determine Bank Nifty strength or weakness and position themselves accordingly.
When combined with indicators like Pulse, Apex, and Equity Matrix, as well as strategic entry and stop-loss placements, the P-Level becomes an essential component of a data-driven trading setup.