Understanding & Usage of Pulse Indicator in BN Data-Driven Trading Setup
The Pulse Indicator is a highly sensitive tool derived from Bank Nifty's intraday data that helps traders assess market strength or weakness. It reacts to even small fluctuations in price, making it an essential indicator for spotting potential trend reversals and pullbacks. By analysing the Pulse Indicator, traders can determine whether Bank Nifty is gaining strength or showing signs of weakness, allowing them to make better-informed trading decisions.
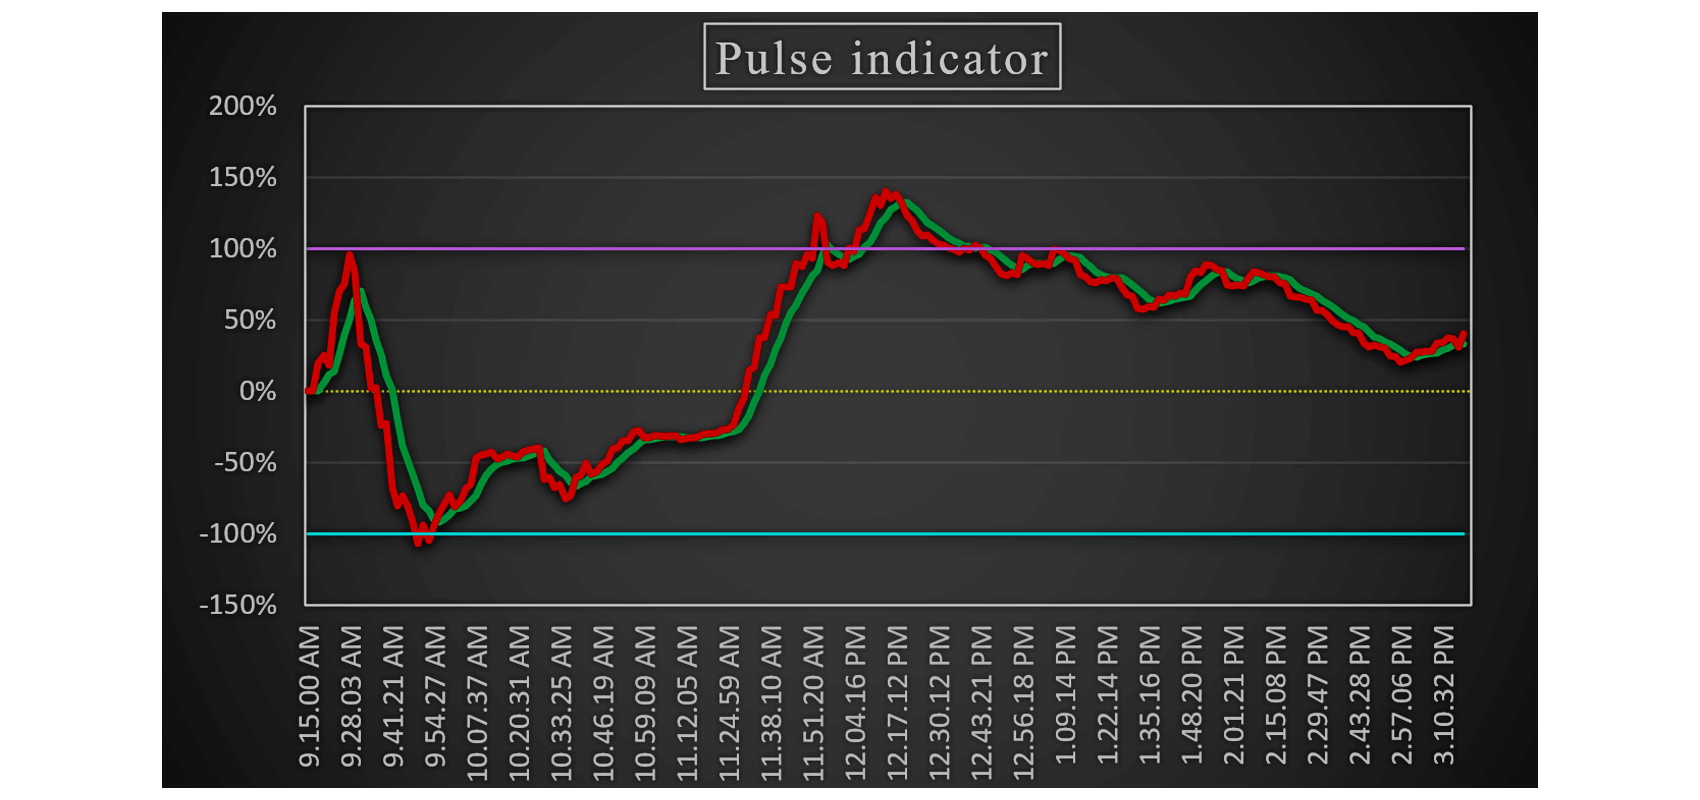
Key Levels in the Pulse Indicator
The Pulse Indicator operates within three key levels that help traders identify overbought and oversold conditions:
+100% Level
Overbought Zone
Market may reverse downward
0 Level
Neutral Zone
Indicates no strong trend
-100% Level
Oversold Zone
Market may reverse upward
How to Interpret the Pulse Indicator
- When the Pulse Indicator is above 0, it indicates that Bank Nifty is showing strength, suggesting a bullish sentiment.
- When the Pulse Indicator is below 0, it signifies weakness in Bank Nifty, indicating bearish sentiment.
By observing how the indicator moves around these levels, traders can anticipate potential trend shifts and adjust their strategies accordingly.
How to Use the Pulse Indicator in Intraday Trading
Identifying Reversal Zones
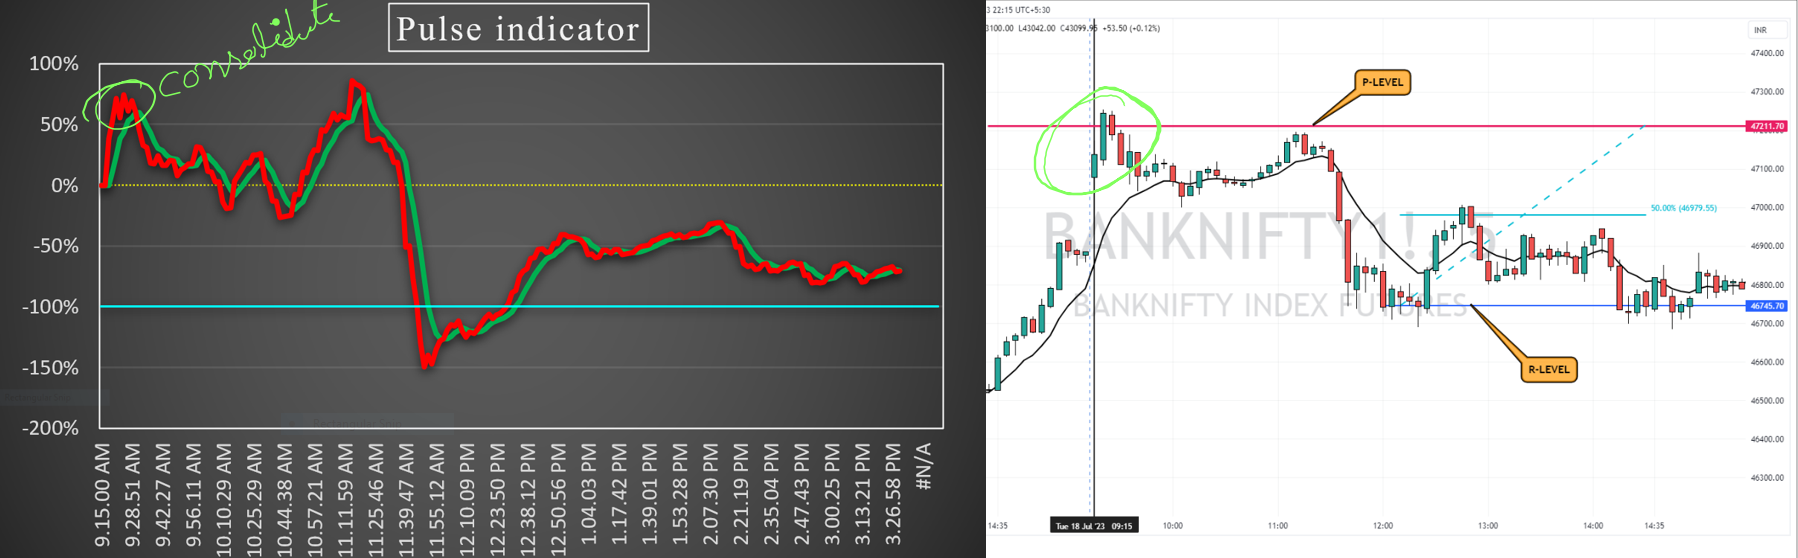
One effective way to use the Pulse Indicator is by spotting potential reversals in Bank Nifty. Suppose Bank Nifty is making higher highs in the morning, and the Pulse Indicator is rising sharply alongside it—this confirms a strong uptrend. However, if the Pulse Indicator stops rising and begins to consolidate, it suggests that the momentum is fading and a reversal may be near.
The same logic applies in a downtrend—if the Pulse Indicator stops declining and starts consolidating, it could signal that a reversal to the upside is approaching.
How to Trade This Setup?
If the Pulse Indicator stops increasing and begins consolidating, traders should avoid entering fresh long positions. Instead, they should look for price action confirmation in the form of resistance levels or reversal candle patterns. If signs of a reversal appear, a short trade can be initiated, with a stop-loss placed above the recent high for risk management.
Key Rules for Drawing R-Levels
The Reversal Level (R-Level) is an important concept that helps traders identify key support and resistance areas using the Pulse Indicator.
The rules for drawing R-Levels are as follows:
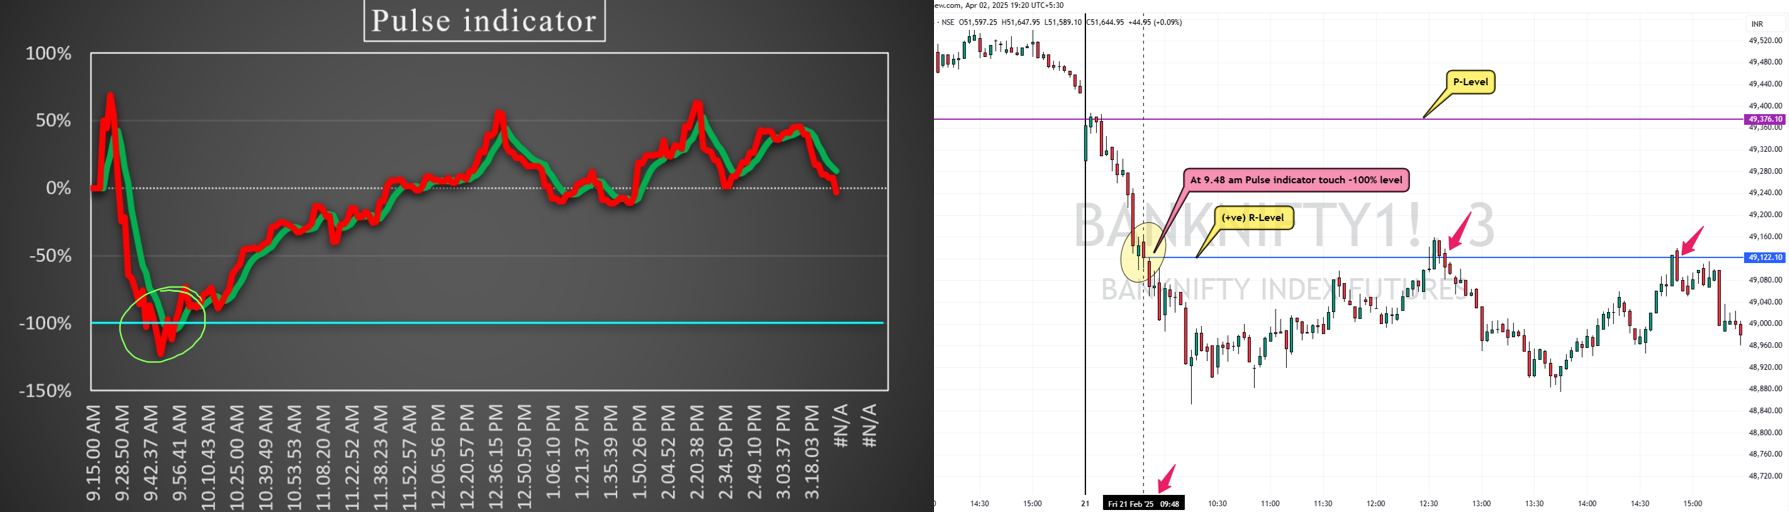
- When the Pulse Indicator touches -100%, we draw a +ve R-Level at the exact price level on the chart at that moment.
- When the Pulse Indicator touches +100%, we draw a -ve R-Level at the exact price level on the chart at that moment.
- The stronger the Pulse Indicator movement, the more significant the R-Level becomes.
- R-Levels act as important support and resistance zones, guiding traders in their decision-making.
These R-Levels provide traders with clear reference points to anticipate market reactions and structure their trades effectively.
Pulse Indicator Reaching +100 Level (Overbought Zone)
When the Pulse Indicator touches +100, it signals that Bank Nifty has entered the overbought zone. At this point, traders should be cautious, as a price reversal may be imminent. A negative R-Level (Reversal Level) should be marked on the price chart using a blue line to indicate potential resistance.
Trading Plan Based on (-ve) R-Level:
- If Bank Nifty faces resistance at the (-ve) R-Level, a short trade can be initiated below this level.
- If Bank Nifty breaks above the R-Level, traders should wait for a long entry above this level for confirmation of continued strength.
Pulse Indicator Reaching -100 Level (Oversold Zone)
When the Pulse Indicator touches -100, it signals that Bank Nifty has entered the oversold zone. Similar to the overbought condition, a potential reversal may occur. At this point, a positive R-Level (Reversal Level) should be drawn on the price chart using a blue line to indicate possible support.
Trading Plan Based on (+ve) R-Level:
- If Bank Nifty finds support at the (+ve) R-Level, a long trade can be initiated above this level.
- If Bank Nifty breaks below the R-Level, traders should wait for a fresh short entry below this level to confirm continued weakness.
The Reversal Level (R-Level) acts as a dynamic support and resistance zone, helping traders make more accurate entries and exits.
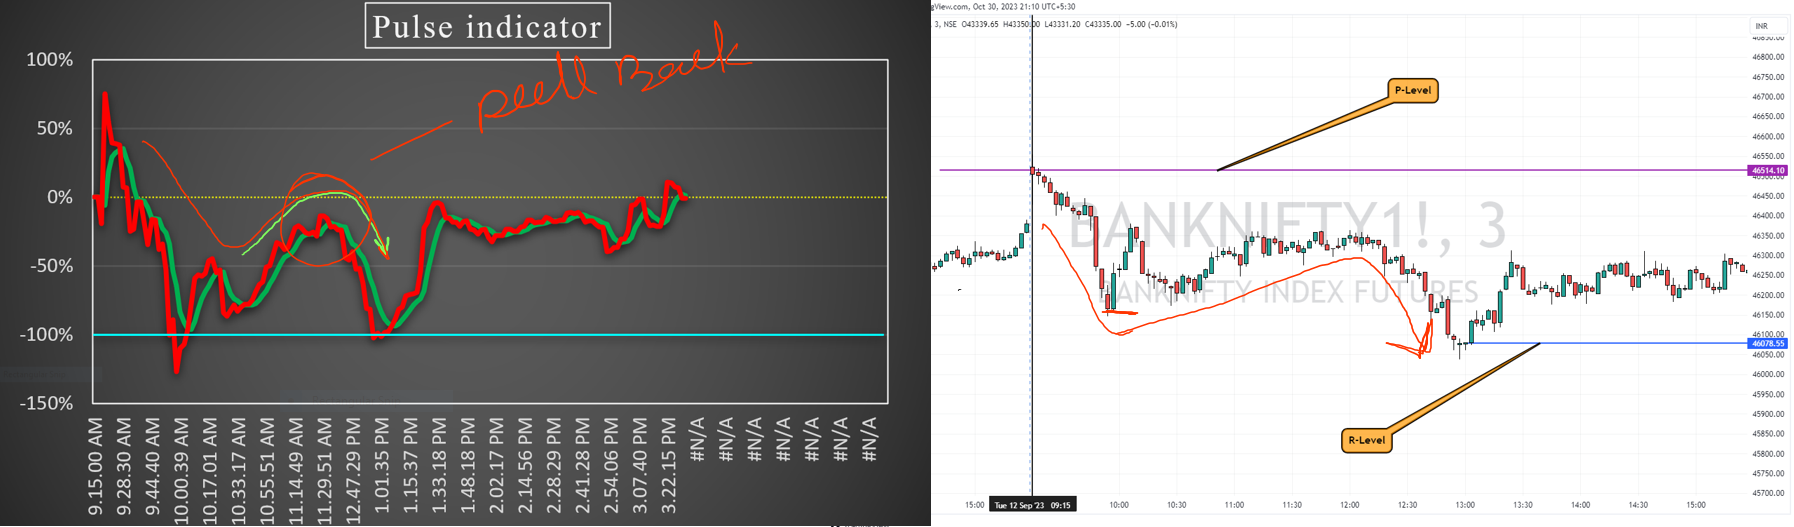
Using the Pulse Indicator for Pullback Trades
The Pulse Indicator can also be used to identify pullback opportunities when it moves between key levels. Instead of full reversals, these setups help traders enter trades in the direction of the main trend after a temporary price retracement.
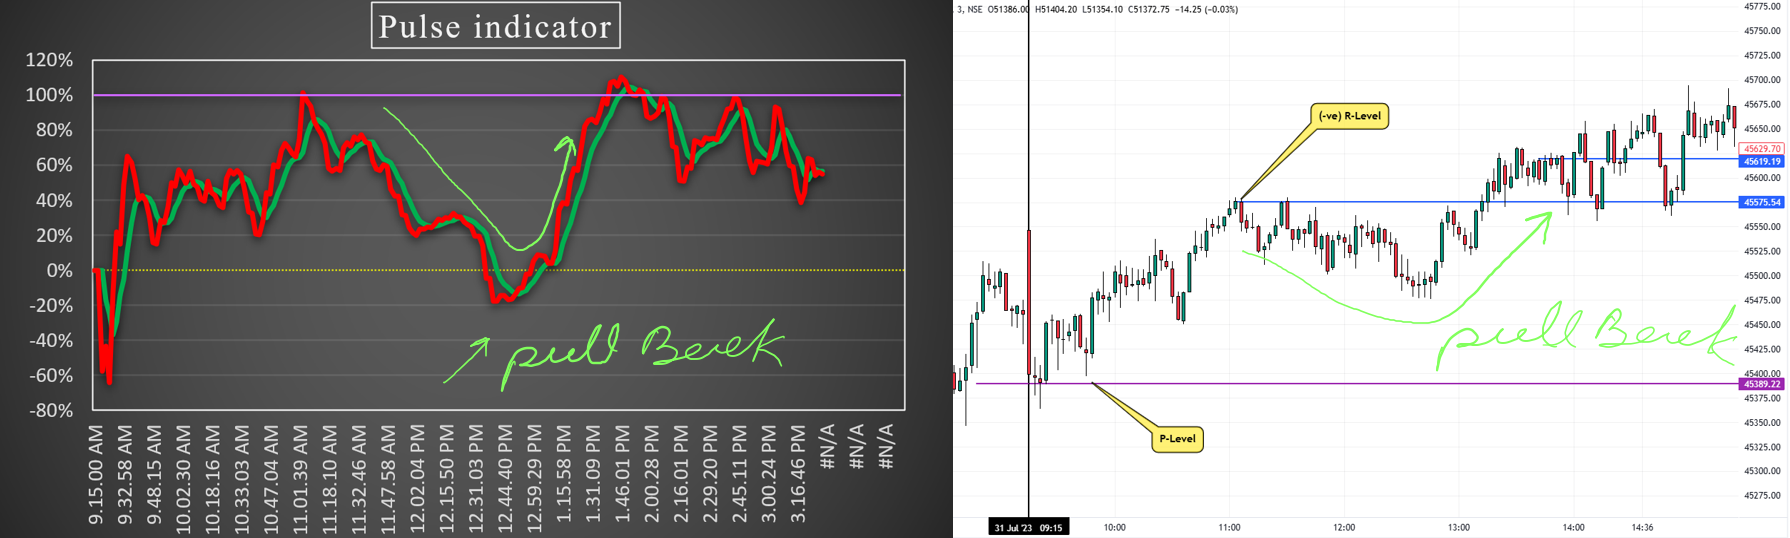
Upside Pullback Trade Setup
If the Pulse Indicator is above the zero line and reaches +100 (overbought zone), it confirms that Bank Nifty is in a strong uptrend. After touching +100, if the Pulse Indicator starts falling toward zero, it suggests a healthy pullback rather than a complete reversal.
When the Pulse Indicator reaches the zero level and starts rising again, traders should look for Bank Nifty to find support at a key price level. If support is confirmed, a long pullback trade can be initiated.
- Entry: When price stabilizes and Pulse Indicator starts increasing from the zero level.
- Stop-loss: Below the recent swing low to protect against downside risk.
Downside Pullback Trade Setup
If the Pulse Indicator is below the zero line and reaches -100 (oversold zone), it confirms that Bank Nifty is in a strong downtrend. After touching -100, if the Pulse Indicator starts rising toward zero, it signals a potential pullback.
When the Pulse Indicator reaches the zero level, it suggests that the pullback may be ending. If Bank Nifty faces resistance at a key level, traders can initiate a short trade based on price rejection signals.
- Entry: When resistance is confirmed and Pulse Indicator fails to move above zero.
- Stop-loss: Above the recent swing high to limit potential losses.
Final Thoughts
The Pulse Indicator is a powerful tool for Bank Nifty intraday traders, helping them identify market strength, weakness, reversals, and pullbacks. By understanding key levels such as +100 (overbought) and -100 (oversold) and incorporating R-Levels as dynamic support and resistance, traders can develop a structured and disciplined trading strategy.
When used in combination with price action, support/resistance, and stop-loss management, the Pulse Indicator enhances decision-making and improves the overall accuracy of trades. By mastering its interpretation and application, traders can increase their edge in the Bank Nifty market and make more confident trading decisions.